
Introduction to Statistical Inference
Statistical inference allows scientists to make generalizations about populations using data drawn from samples. It is based on probability theory, specifically the behavior of sampling distributions. In psychology and other social sciences, where entire populations are rarely accessible, inference provides a framework for evaluating hypotheses, estimating parameters, and determining the likelihood that observed results are due to chance (Howell, 2009). Standard Error of the Mean (SEM) is a statistical measure that quantifies the precision of a sample mean as an estimate of the true population mean. It reflects how much the sample mean would vary from one sample to another if we repeatedly took samples from the same population.
Read More- Percentile and Percentile Rank
Concept of the Sampling Distribution
A sampling distribution is the probability distribution of a given statistic based on a random sample. For example, the sampling distribution of the mean illustrates the variability of sample means around the population mean. Central to this concept is the Central Limit Theorem (CLT), which states that regardless of the population distribution, the sampling distribution of the mean will approach a normal distribution as the sample size increases (n > 30 is often cited as a rule of thumb).
Definition and Derivation of the Standard Error of the Mean (SEM)
The SEM measures the dispersion of sample means around the sample mean. It is mathematically defined as:
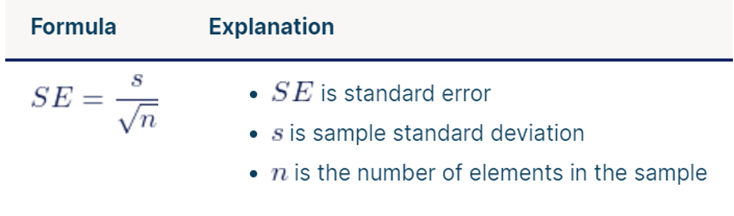
This formula highlights that as sample size increases, the SEM decreases, indicating more precise estimates of the population mean.
Importance of the SEM
The SEM plays a critical role in:
- Estimating the population mean: SEM allows us to construct confidence intervals.
- Hypothesis testing: SEM is used in calculating test statistics (e.g., t-tests).
- Evaluating reliability: Lower SEMs indicate higher precision.
A common misunderstanding is to equate the SEM with the standard deviation. While the standard deviation quantifies variability within a single sample, the SEM quantifies variability among sample means.
Confidence Intervals Using SEM
Confidence intervals (CIs) use the SEM to express the range within which the population parameter is likely to fall:
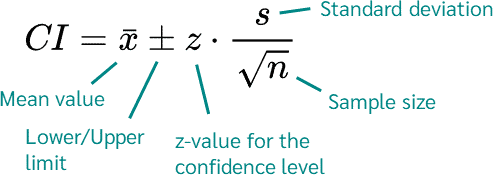
Confidence Interval
For instance, a 95% CI means we are 95% confident that the true population mean lies within this interval. This is not the probability the mean is in the interval; rather, it is a statement about the method’s reliability.

SEM and Confidence Interval
Other Types of Standard Errors
Several other standard errors serve similar inferential functions:
- Standard Error of the Difference Between Means
- Standard Error of Proportion
- Standard Error of Correlation Coefficients
Each plays a role in constructing CIs and performing hypothesis tests specific to the type of data or relationship being studied.
Factors Affecting the SEM
The SEM is influenced by:
- Sample size (n): Larger samples produce smaller SEMs.
- Population variability: Greater variability increases SEM.
- Measurement precision: Instruments and methodology impact variability.
Conclusion
The SEM is a cornerstone of inferential statistics, enabling accurate parameter estimation and hypothesis testing. Its appropriate use and interpretation are essential for rigorous scientific inference.
References
Howell, D. C. (2009). Statistical Methods for Psychology (7th ed.). Wadsworth Cengage Learning.
Cohen, J. (1988). Statistical Power Analysis for the Behavioral Sciences (2nd ed.). Lawrence Erlbaum Associates.
Niwlikar, B. A. (2025, July 4). Standard Error of the Mean (SEM) Statistics and 3 Important Factors Affecting It. Careershodh. https://www.careershodh.com/standard-error-of-the-mean-sem-statistics/