
Introduction
Simple linear regression is a foundational statistical method used to model the relationship between two continuous variables: one independent (predictor) and one dependent (outcome). It helps predict the outcome variable based on the values of the predictor, assuming a linear association.
Read More- Reliability
The Regression Model
The general form of a simple linear regression equation is:
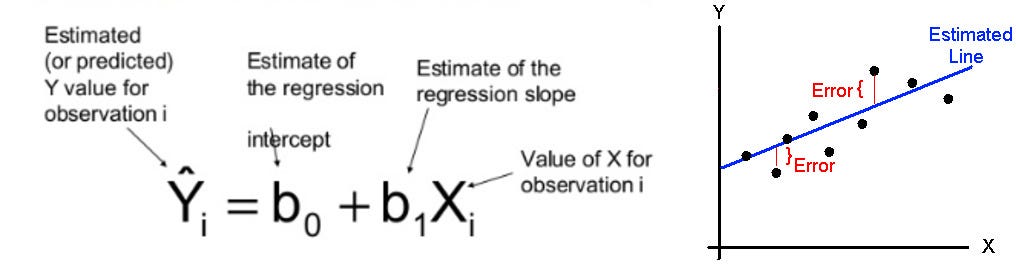
Linear Regression
Estimating the Regression Coefficients
The slope and intercept are estimated as:
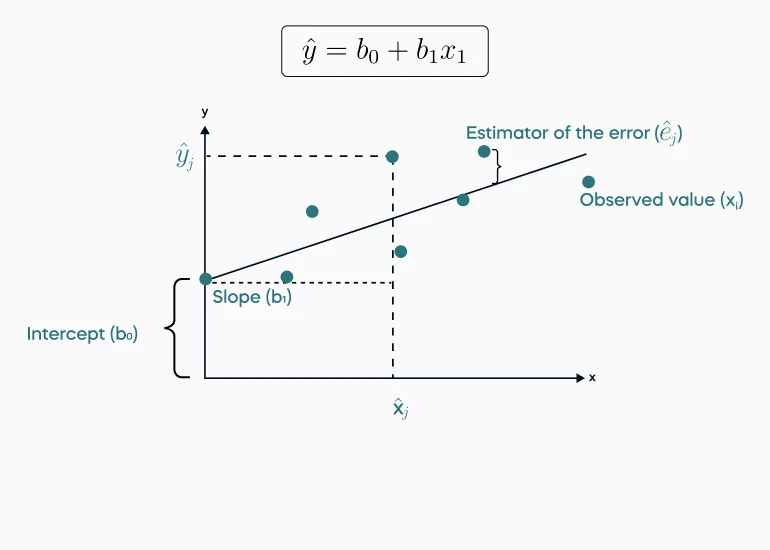
Linear Regression Slope
These equations define the best-fitting line through the data points.
Assumptions of Simple Linear Regression
To yield valid inferences, regression analysis relies on:
- Linearity: Relationship between X and Y is linear.
- Independence: Observations are independent.
- Homoscedasticity: Equal variance of errors across all levels of X.
- Normality: Errors are normally distributed
Violations may require transformation or use of nonparametric techniques.
Conceptual Difference Between Correlation and Regression
- Correlation is symmetrical: measures strength/direction.
- Regression is directional: predicts Y from X.
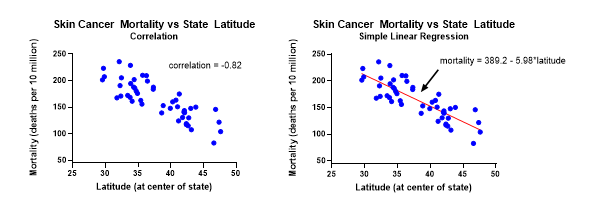
Correlation and Linear Regression
In regression, X may be fixed (experimentally manipulated), while correlation treats both variables as random.
Graphical Representation
A scatterplot with the regression line shows:
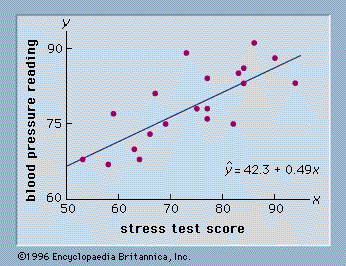
Scatter Plot
- Strength and direction of relationship.
- Residuals as vertical deviations from the line.
- Fit quality: tighter the points, better the prediction.
Limitations
- Cannot infer causation from regression alone.
- Sensitive to outliers and nonlinearity.
- Assumes no measurement error in X (violated in many behavioral sciences applications).
Extensions
Simple linear regression sets the stage for:
- Multiple regression (more predictors).
- Logistic regression (binary outcomes).
- Polynomial regression (nonlinear trends).
- ANOVA (as a regression problem)
Conclusion
Simple linear regression remains a powerful, interpretable tool for prediction and understanding associations. By fitting a line to data, it enables psychologists, educators, and social scientists to quantify trends, make forecasts, and test hypotheses—provided assumptions are met and results carefully interpreted.
References
Howell, D. C. (2009). Statistical Methods for Psychology (7th ed.). Wadsworth Cengage Learning.
Cohen, J., Cohen, P., West, S. G., & Aiken, L. S. (2003). Applied multiple regression/correlation analysis for the behavioral sciences (3rd ed.). Routledge.
Field, A. (2013). Discovering Statistics Using IBM SPSS Statistics (4th ed.). Sage Publications.
Tabachnick, B. G., & Fidell, L. S. (2019). Using Multivariate Statistics (7th ed.). Pearson.
Niwlikar, B. A. (2025, July 3). Linear Regression and 4 Important Assumptions of It. Careershodh. https://www.careershodh.com/linear-regression/