
Introduction
In psychological and educational measurement, one of the major challenges is interpreting individual performance in a way that is meaningful, accurate, and comparable across different tests, populations, and contexts. While raw scores (the unadjusted results of assessments) are foundational, they often lack context. For instance, a score of 72 on a mathematics test has little meaning unless one knows how others performed or how the test is scaled.
To address this, professionals rely on derived scores—percentiles, percentile ranks, and standard scores—to provide standardized interpretations of performance. These measures facilitate comparison across individuals and groups, contextualize raw results within a distribution, and enable meaningful decision-making. They are essential tools in norm-referenced assessments, where the goal is to evaluate an individual’s standing relative to a defined population.
Read More- Reliability in Testing
1. Percentiles
A percentile is a point in a distribution below which a certain percentage of observations fall. For example, the 85th percentile represents the score below which 85% of the data lies. Unlike a raw score, which gives absolute performance, a percentile gives relative performance within a distribution.
Percentiles divide a distribution into 100 equal parts. They can be thought of as specific data points marking the cumulative percentage of scores below a given value.
Calculation of Percentiles
To determine a percentile:
- Order the data from smallest to largest.
- Calculate the rank position using the formula:
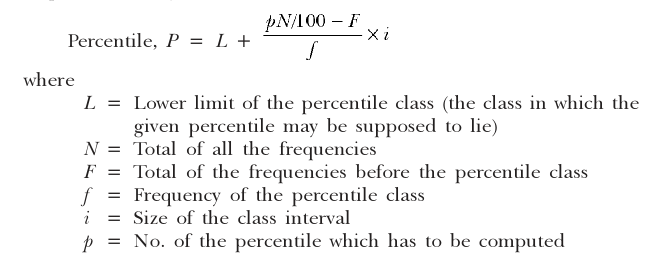
Percentile Formula
The actual percentile value is then the score located at or interpolated from that rank.
Examples and Use Cases
- A score at the 50th percentile is the median, representing the midpoint of a dataset.
- 25th percentile (Q1) and 75th percentile (Q3) are commonly used to determine the interquartile range (IQR), a measure of variability.
- Percentiles are frequently used in growth charts, standardized test reporting, and benchmarking performance.
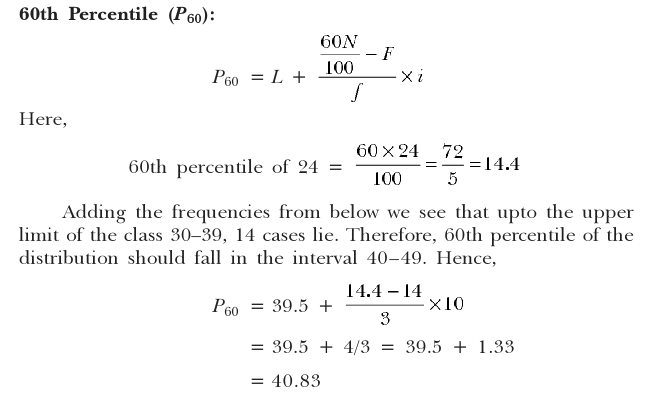
Example of Percentile
2. Percentile Ranks
The percentile rank of a given score tells you the percentage of scores in its frequency distribution that are equal to or lower than it. This gives an individual’s relative standing within a reference group.
Distinguishing Percentile and Percentile Rank
Although often used interchangeably, they differ slightly:
- Percentile (value-based): “What score corresponds to the 85th percentile?”
- Percentile Rank (rank-based): “What percentile rank does a score of 85 receive?”
Percentile ranks are ordinal, meaning they tell you the order but not the distance between scores.
Calculation of Percentile Rank
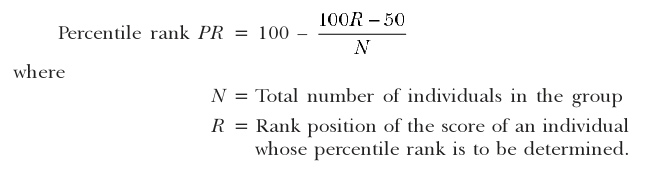
Percentile Rank
This formula ensures that the percentile rank takes into account both lower scores and those equal to the target score, with 0.5 accounting for the midpoint.
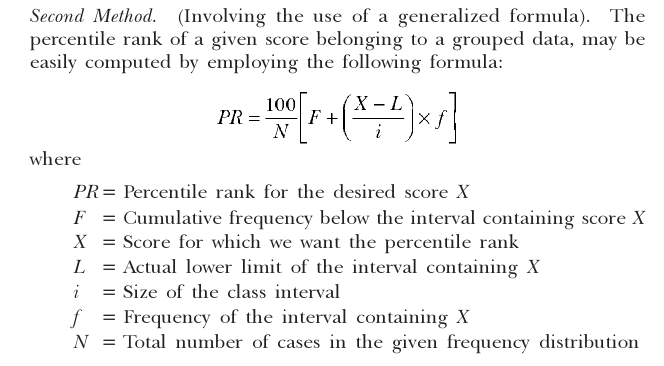
Alternative PR Formula
Applications
- A student with a percentile rank of 90 performed as well or better than 90% of the test takers.
- Percentile ranks are used in norm-referenced tests like SAT, GRE, and state assessments.
- They are helpful in clinical psychology for understanding how an individual’s score compares to a normative sample (e.g., behavior rating scales).
3. Standard Scores
Standard scores are transformations of raw scores into a common scale with a known mean and standard deviation. These scores are particularly valuable for:
- Making direct comparisons across different tests or measures.
- Understanding how far and in what direction a score deviates from the group average.
- Performing statistical analyses, as standard scores are interval-level measurements.
Types of Standard Scores
The four main types of standardised scores are-
1. Z-Scores
A z-score represents the number of standard deviations a score is from the mean. It is calculated as:
Z Score
A z-score of 0 is exactly at the mean. Positive z-scores indicate above-average performance; negative scores indicate below-average.
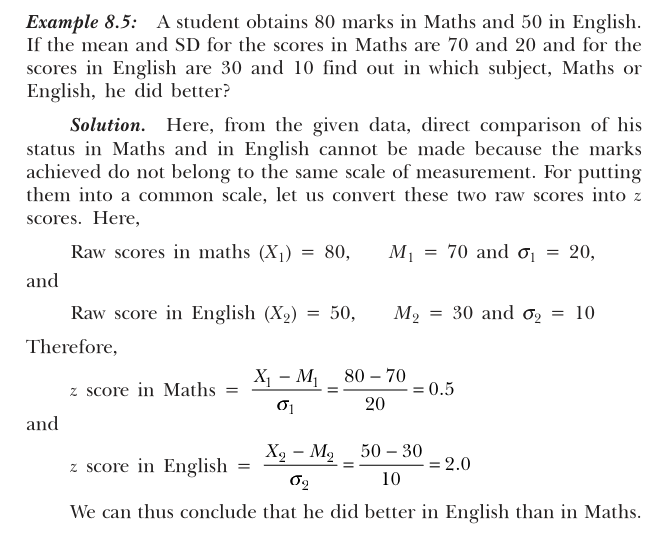
Calculating Z Score
2. T-Scores
T-scores are standardized z-scores scaled to have a mean of 50 and standard deviation of 10. The formula is:

Standard Scores
T-scores are widely used in psychological testing (e.g., MMPI, behavior inventories) because they avoid negative numbers and decimal places, making them easier to interpret.
3. IQ Scores
Intelligence quotient (IQ) scores are a type of standard score with:
- Mean = 100
- Standard deviation = 15
A score of 130 would be two standard deviations above the mean, indicating very high performance. IQ scores are used in intelligence tests such as the Wechsler Intelligence Scale for Children (WISC) and the Stanford-Binet Intelligence Scales.
4. Stanines and Normal Curve Equivalents (NCEs)
Other less common standard scores include:
- Stanines (standard nines): Mean = 5, SD = 2, scaled from 1 to 9.
- NCEs: Mean = 50, SD = 21.06, allowing linear transformations while maintaining equal-interval properties.
These formats are often used in large-scale educational testing and reporting.
Best Practices in Using Standardized Scores
While using these scores, several best practices should be followed:
1. Contextual Interpretation
Always consider the norm group from which percentiles or standard scores are derived. A child performing in the 90th percentile on a reading test normed on a national sample of 8th graders may not be in the 90th percentile when compared to peers in a selective academic program.
2. Combining Measures
Single metrics can mislead. Psychologists often use a battery of assessments, integrating:
- Standard scores (e.g., IQ tests)
- Percentile ranks (e.g., academic performance)
- Behavioral observations
- Interview data
This multi-source approach ensures more valid conclusions.
3. Visual Representation
Graphing percentile distributions, z-scores, or standard score comparisons (e.g., bar charts, bell curves) aids in communicating results to non-expert audiences, such as parents or school administrators.
Conclusion
Percentiles, percentile ranks, and standard scores are essential tools for translating raw data into meaningful, comparative metrics. They enable:
- Fair evaluation across populations,
- Informed educational or clinical decisions,
- Robust research findings.
When used responsibly—with awareness of their assumptions and limitations—these derived scores offer clarity, precision, and fairness in assessing human behavior, cognition, and learning outcomes.
References
Howell, D. C. (2009). Statistical Methods for Psychology (7th ed.). Wadsworth Cengage Learning.
Mangal, S. K. (2010). Statistics in Psychology and Education (2nd ed.). PHI Learning Pvt. Ltd.
Thorndike, R. L., & Thorndike-Christ, T. M. (2010). Measurement and Evaluation in Psychology and Education (8th ed.). Pearson.
American Educational Research Association, APA, & NCME. (2014). Standards for Educational and Psychological Testing.
Niwlikar, B. A. (2025, June 24). Percentiles, Percentile Ranks, and Standard Scores: 3 Important Concepts in Statistics. Careershodh. https://www.careershodh.com/percentiles-percentile-ranks-and-standard-scores/