
Introduction
Modern research demands accurate statistical analysis, and software tools have become indispensable. Among the most popular packages for researchers and practitioners are SPSS (Statistical Package for the Social Sciences) and Microsoft Excel.
Read More- Partial and Multiple Correlation
1. SPSS
SPSS, originally developed by Norman Nie and colleagues in 1968, has evolved into one of the most widely used programs for social science statistics (Nie et al., 1970). Now owned by IBM, SPSS offers a comprehensive suite for data management, statistical analysis, and reporting.
Key Features:
- User-friendly GUI with point-and-click operations.
- Extensive range of statistical procedures: descriptive statistics, t-tests, ANOVA, regression, factor analysis, non-parametric tests, and more.
- Data editor similar to spreadsheets.
- Syntax editor for reproducible scripts.
- Graphical outputs for charts and plots.
Applications:
- Social science surveys
- Market research
- Medical statistics
- Educational research
Basic Workflow in SPSS:
- Enter or import data in the Data View.
- Define variables in the Variable View.
- Analyze using the menu: Analyze → Descriptive Statistics → Frequencies, for example.
- View output in the Output Viewer.
- Create graphs through Graphs → Legacy Dialogs.
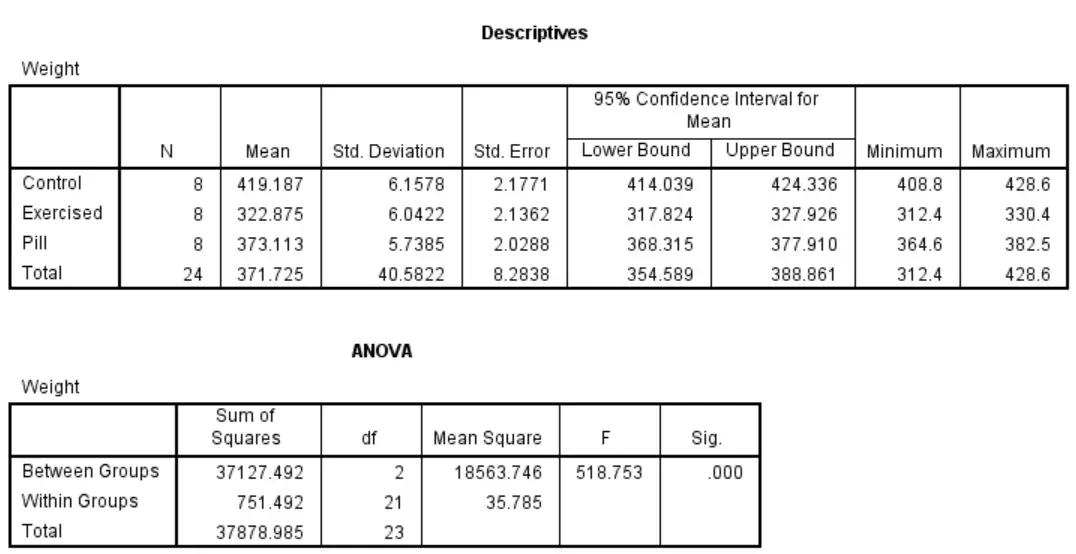
ANOVA Output SPSS
Advantages:
- Handles large datasets.
- Robust error checking.
- Integrated output management.
Limitations:
- Commercial license required.
- Less flexible for automation compared to programming-based tools like R or Python.
2. Excel
Microsoft Excel is ubiquitous in offices, classrooms, and research labs. While primarily a spreadsheet application, Excel offers numerous built-in statistical functions and analysis tools.
Key Features:
- Easy data entry and formatting.
- Built-in functions like AVERAGE(), STDEV.P(), MEDIAN(), and advanced formulas.
- Data Analysis Toolpak add-in for t-tests, ANOVA, regression, and descriptive stats.
- Charts for visualization: histograms, scatterplots, boxplots.
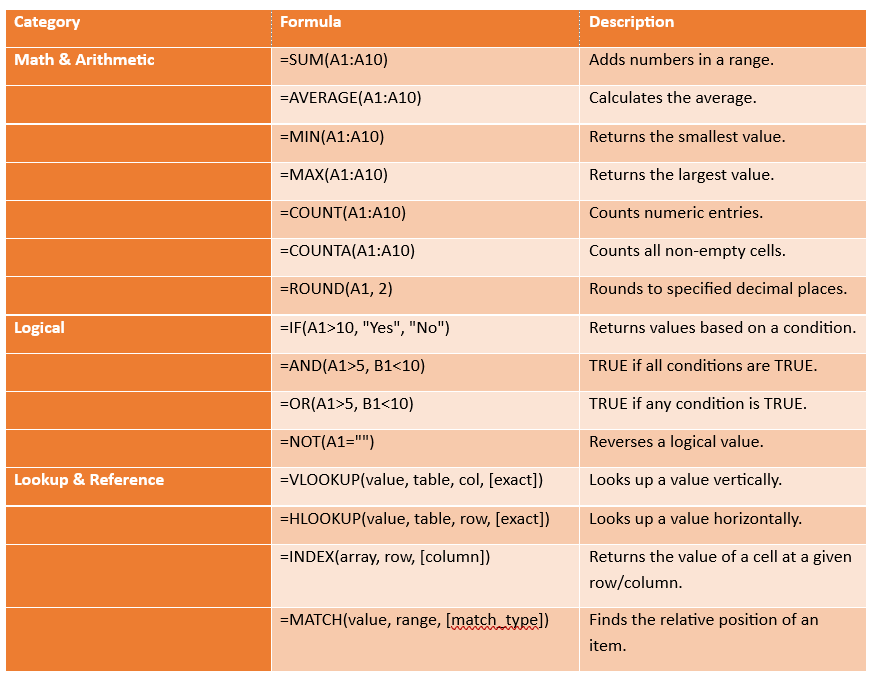
Excel Formulas
Applications:
- Quick exploratory analysis
- Small-scale statistical tasks
- Budgeting and forecasting
- Classroom exercises
Basic Workflow in Excel:
- Enter data in cells.
- Use formulas or Data then Data Analysis for statistical tests.
- Create charts through Insert then Charts.
Advantages:
- Widely available.
- Intuitive for beginners.
- Integrated with Office suite.
Limitations:
- Prone to human error with manual data handling.
- Limited advanced statistical procedures.
- Poor reproducibility compared to scripted software.
Recommendations for Use
- Use SPSS when your analysis requires advanced statistics, reproducible syntax, or when working with large, complex datasets.
- Use Excel when you need quick calculations, exploratory analysis, or integration with other Office tools.
Conclusion
SPSS and Excel are powerful tools for statistical analysis, each suited for different contexts. Mastering these tools enhances researchers’ ability to perform rigorous analyses and communicate results effectively.
References
Nie, N. H., Bent, D. H., & Hull, C. H. (1970). SPSS: Statistical package for the social sciences (2nd ed.). McGraw-Hill.
Field, A. (2017). Discovering statistics using IBM SPSS Statistics (5th ed.). Sage.
Walkenbach, J. (2013). Excel 2013 Bible. Wiley.
Niwlikar, B. A. (2025, July 14). 2 Important Softwares for Data Analysis. Careershodh. https://www.careershodh.com/softwares-for-data-analysis/