
Introduction
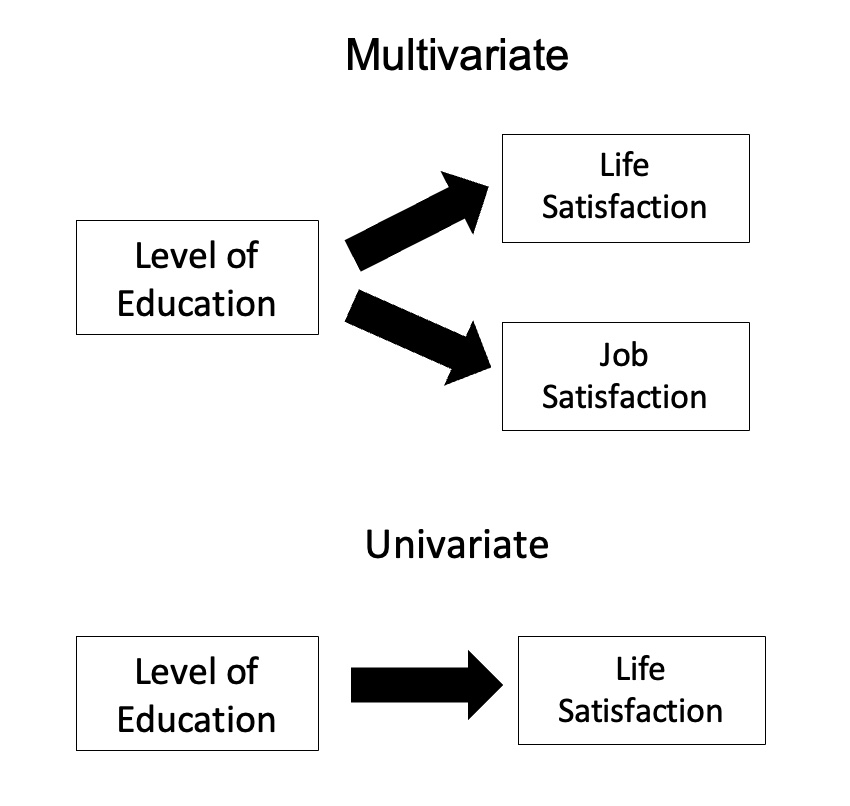
In psychological and behavioral sciences, researchers often need to analyze multiple variables simultaneously to capture the complexity of human behavior. Simple univariate analyses (which involve a single dependent variable) often miss the interrelationships among variables that naturally exist in real-world phenomena.
Read More- Reliability in Testing
Multivariate Techniques
Multivariate techniques refer to a broad set of statistical methods that allow simultaneous examination of multiple dependent (outcome) variables and multiple independent (predictor) variables.
Multivariate Analysis
These techniques consider the intercorrelations among variables and provide a more comprehensive picture of the underlying data structure. They are essential in fields like psychology, education, sociology, and health sciences where complex constructs (e.g., intelligence, motivation, anxiety) are studied.
Multivariate techniques can:
- Explore complex relationships between variables.
- Control for multiple confounding factors.
- Identify latent structures (underlying, unobserved factors).
- Predict outcomes based on multiple predictors.
- Classify individuals into categories based on several predictors.
1. Multiple Regression Analysis
Multiple regression is a statistical method used to predict the value of a single dependent variable based on two or more independent variables (predictors). It extends simple linear regression (which involves one predictor) by considering multiple predictors simultaneously.
The Regression Equation
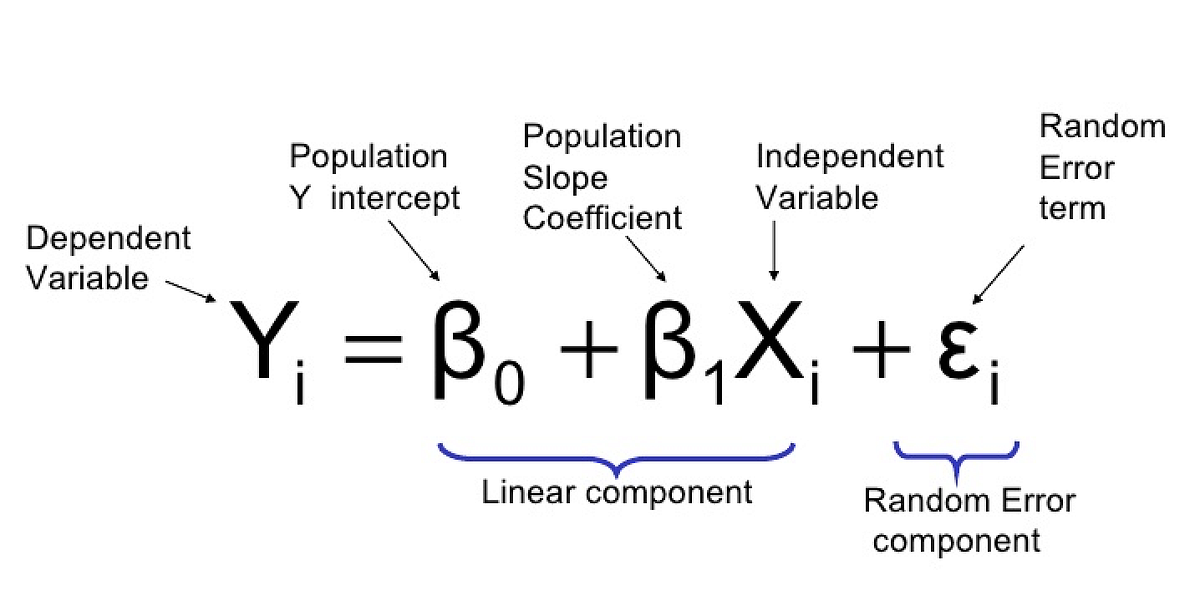
Linear Regression
Assumptions
- Linearity: Relationships between predictors and the dependent variable are linear.
- Independence of errors: Residuals (errors) are independent of each other.
- Homoscedasticity: Variance of residuals is constant across predictor levels.
- Normality of residuals: Errors are normally distributed.
Interpretation
Multiple regression quantifies the relative importance of each predictor and can determine which predictors have the most influence on the outcome.
2. Multivariate Analysis of Variance (MANOVA)
MANOVA extends ANOVA by examining group differences across multiple dependent variables simultaneously. It accounts for the correlations among dependent variables and controls for the family-wise Type I error rate (inflation of false positives) that occurs when running multiple separate ANOVAs.
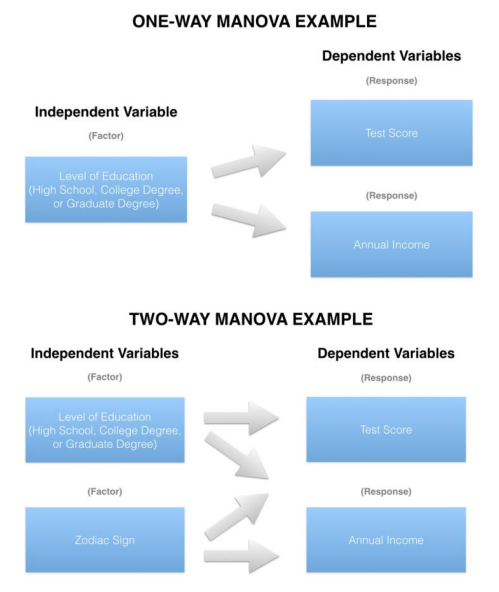
MANOVA and MANCOVA
Key Statistics
- Wilks’ Lambda: Measures the proportion of variance in the dependent variables not explained by group differences.
- Pillai’s Trace, Hotelling’s Trace, Roy’s Largest Root: Alternative multivariate tests with varying robustness to assumption violations.
Assumptions
- Multivariate normality: Dependent variables follow a multivariate normal distribution.
- Homogeneity of variance-covariance matrices: Equality of covariances across groups.
- Independence of observations.
Interpretation
A significant MANOVA suggests that group membership affects a combination of dependent variables. Follow-up analyses (e.g., univariate ANOVAs, discriminant analysis) determine where the differences lie.
3. Path Analysis and Structural Equation Modeling (SEM)
Path analysis and SEM are advanced techniques for modeling complex causal relationships among observed and latent (unmeasured) variables. While path analysis focuses on observed variables, SEM integrates latent variables and their measurement error, making it highly suitable for psychological constructs like intelligence, motivation, and anxiety.
Components
- Path coefficients: Represent direct effects between variables.
- Direct, indirect, and total effects: Partition relationships into direct and mediated (indirect) effects.
- Latent variables: Unobserved constructs measured through multiple indicators (questionnaire items).
SEM Model Fit Indices
- Chi-square: Tests the discrepancy between the model and data; nonsignificant indicates good fit.
- RMSEA (Root Mean Square Error of Approximation): < 0.08 indicates reasonable fit.
- CFI/TLI: Comparative fit indices; > 0.90 indicates acceptable fit.
Assumptions
- Multivariate normality of observed variables.
- Adequate sample size for model complexity.
- Correct model specification (relationships hypothesized align with data).
Interpretation
SEM provides a holistic view of relationships, including direct, indirect (mediated), and total effects. It accounts for measurement error, leading to more accurate conclusions.
4. Discriminant Function Analysis (DFA)
DFA is used to classify cases into predefined categorical groups based on continuous predictors. It finds the linear combination of predictors that best separates groups.
Assumptions
- Multivariate normality of predictors.
- Homogeneity of variance-covariance matrices across groups.
- Linear relationships among variables.
Interpretation
DFA yields discriminant functions—linear combinations of predictors—that maximize group separation. The classification matrix shows how well the model predicts group membership.
5. Canonical Correlation
Canonical correlation analysis (CCA) explores relationships between two sets of variables by identifying pairs of linear combinations (canonical variates) that are maximally correlated.

Canonical Correlation
Process
- For each set of variables (e.g., set X and set Y), compute canonical variates (linear combinations).
- Identify canonical correlations between the pairs of variates.
- Examine cross-loadings to interpret relationships.
Assumptions
- Multivariate normality of both variable sets.
- Linearity of relationships
Interpretation
CCA provides insight into how entire sets of variables relate rather than examining pairwise correlations. It is ideal when studying multidimensional constructs.
Conclusion
Multivariate techniques are indispensable in psychological and behavioral sciences research. They enable researchers to explore complex relationships, model latent constructs, control for multiple confounding factors, and make predictions or classifications based on multiple variables. Each technique—whether it is multiple regression, MANOVA, path analysis and SEM, discriminant analysis, or canonical correlation—offers unique insights and applications. Choosing the appropriate method depends on the research question, data structure, and assumptions.
Mastery of multivariate techniques empowers researchers to derive meaningful conclusions from complex datasets, advancing our understanding of human behavior and psychological phenomena.
References
Shaughnessy, J. J., Zechmeister, E. B., & Zechmeister, J. S. (2014). Research Methods in Psychology (10th ed.). McGraw-Hill Education.
Singh, A. K. (2014). Tests, Measurements and Research Methods in Behavioural Sciences. Bharati Bhawan.
Jolliffe, I. T., & Cadima, J. (2016). Principal component analysis: A review and recent developments. Philosophical Transactions of the Royal Society A, 374(2065).
Tabachnick, B. G., & Fidell, L. S. (2019). Using Multivariate Statistics (7th ed.). Pearson.
Kline, R. B. (2015). Principles and Practice of Structural Equation Modeling (4th ed.). Guilford Press.
Niwlikar, B. A. (2025, June 9). 5 Important Multivariate Analysis Technique. Careershodh. https://www.careershodh.com/5-important-multivariate-analysis-technique/