
Introduction
Probability theory and the normal distribution curve represent two of the most foundational concepts in the field of statistics, especially within disciplines like psychology, education, sociology, and other social sciences. These ideas are not merely theoretical abstractions; rather, they provide the mathematical backbone for how researchers interpret data, draw conclusions, and make predictions. In the context of behavioral and educational research, where variability and uncertainty are inherent, probability allows us to measure the likelihood of different outcomes. Meanwhile, the normal distribution—a bell-shaped curve—serves as a statistical model for how many human traits and behaviors are naturally distributed.
Understanding both probability and the normal distribution is crucial for anyone involved in scientific inquiry or evidence-based practice. These concepts inform key activities such as hypothesis testing, diagnostic evaluation, intervention analysis, and predictive modeling.
Read More- Reliability in Testing
Probability
Definition and Importance
Probability is the mathematical language of uncertainty. It is a quantitative way of expressing the likelihood or chance that a particular event will occur. Formally, the probability of an event is a value between 0 and 1. A probability of 0 indicates that the event will not occur, while a probability of 1 indicates certainty. A value of 0.5 suggests that the event is just as likely to occur as not.
In real-world psychological or educational settings, absolute certainty is rare. When studying human behavior or performance, researchers cannot predict exact outcomes with 100% accuracy because of individual differences, environmental influences, and measurement error. Probability allows researchers to manage this uncertainty by modeling expected outcomes, interpreting data variability, and assessing the strength of evidence.
Approaches to Probability
There are three major conceptual frameworks through which probability is understood:
1. Classical (Theoretical) Probability
Classical probability is based on logical analysis where all possible outcomes are known and equally likely. This approach works well in controlled environments like games of chance. For example, the probability of rolling a three on a fair six-sided die is 1/6, since there is one favorable outcome and six possible outcomes.
However, the classical approach is limited in scope. In real-world applications, especially in social science research, outcomes are rarely equally probable or deterministic. This limitation necessitates alternative approaches.
2. Frequentist Probability
Frequentist probability defines probability as the limit of relative frequency over an infinite number of trials. In simpler terms, it measures how often an event occurs out of a large number of repetitions. For instance, if we flip a fair coin 10,000 times, we would expect approximately 5,000 heads, yielding a probability of 0.5 for heads.
This approach underlies many standard statistical procedures, such as significance testing and confidence intervals. It assumes that patterns observed in large samples will generalize to the population, making it a powerful tool for empirical research.
3. Subjective Probability
Subjective probability is based on personal judgment, belief, or expert opinion rather than strict mathematical calculation. It is often used in situations where empirical data is scarce or unavailable. For example, a psychologist may estimate a 70% chance that a patient will respond positively to cognitive-behavioral therapy based on previous clinical experience.
While more flexible, subjective probabilities can be influenced by cognitive biases, and thus must be used cautiously in formal research settings.
Key Concepts and Rules in Probability
Understanding and applying probability requires familiarity with foundational terms and mathematical rules:
- Experiment: A process that yields observable outcomes (e.g., administering a test).
- Sample Space (S): The set of all possible outcomes (e.g., {heads, tails}).
- Event: A specific outcome or set of outcomes (e.g., rolling an even number).
- Mutually Exclusive Events: Events that cannot occur at the same time (e.g., heads and tails on the same coin toss).
- Exhaustive Events: A collection of events that includes all possible outcomes.
Applications of Probability in Psychology and Education
Probability plays a central role in both theory and practice:
- Hypothesis Testing: Determining whether observed results are statistically significant or due to chance.
- Confidence Intervals: Estimating the range in which a population parameter lies with a given probability.
- Risk Assessment: Estimating the probability of psychological conditions based on test scores.
- Decision Making: Guiding educational interventions based on likely outcomes.
In psychometrics, probability models underpin item response theory, which predicts how likely a person is to answer a test item correctly based on their latent trait level. Similarly, in program evaluation, probability helps estimate the likelihood that an educational program is effective, accounting for confounding variables.
Normal Distribution Curve
Introduction to the Normal Distribution Curve
The normal distribution—often called the Gaussian distribution—is a theoretical model describing how continuous variables are distributed in large populations. Its iconic bell-shaped curve represents a dataset where most values are concentrated around the mean, with frequencies decreasing symmetrically as one moves away from the center.

Normal Distribution
This distribution is incredibly useful because many psychological and educational variables approximate normality. These include intelligence quotient (IQ) scores, reading comprehension levels, and reaction times.
Key Properties of the Normal Curve
- Symmetry: The distribution is perfectly symmetric about the mean, implying no skewness. This means 50% of values lie to the left of the mean and 50% to the right.
- Mean = Median = Mode: In a normal distribution, all three central tendency measures are equal, reinforcing the balance of the curve.
- Bell Shape: The distribution forms a peak at the mean and gradually tapers off, creating a “bell.”
- Infinite Tails: Although practically zero at the extremes, the tails never actually touch the horizontal axis, indicating that extreme values are possible, albeit rare.
- Empirical Rule (68-95-99.7 Rule):
- About 68% of the data fall within ±1 standard deviation of the mean.
- 95% lie within ±2 standard deviations.
- 99.7% lie within ±3 standard deviations.
This rule provides a quick way to understand the spread and concentration of data.
Standard Normal Distribution and z-scores
When raw scores from different distributions need to be compared, researchers convert them into z-scores, which standardize different data onto a common scale:
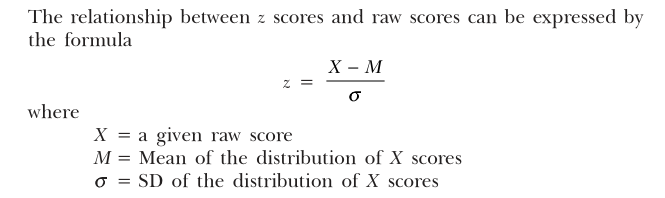
Z Score
Z-scores represent how many standard deviations a score is from the mean. A score of +1.5 means the value is 1.5 standard deviations above the mean, allowing for easy comparison across different tests or populations.
Assessing Normality in Data
Before applying statistical tests that assume normality (like t-tests or ANOVA), it’s essential to check whether the data approximate a normal distribution:
1. Visual Inspection:
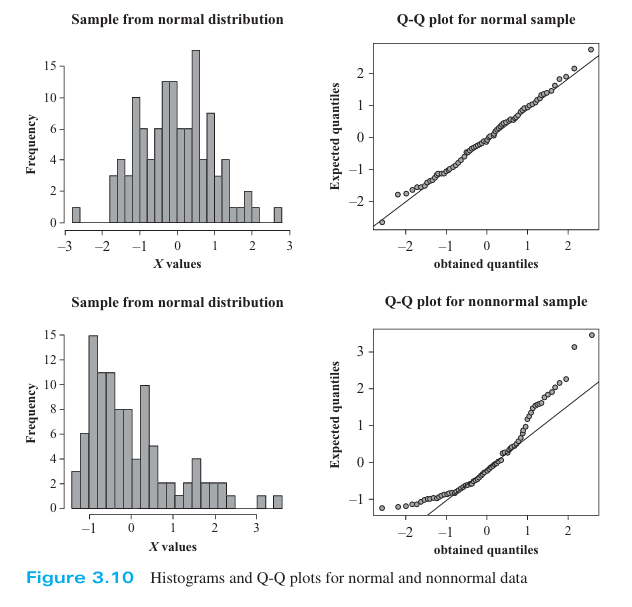
Visual Description of NDC
- Histogram: Should resemble a bell curve.
- Q-Q Plot: Should align along a 45-degree line if the distribution is normal.
2. Descriptive Measures:
- Skewness: Measures asymmetry. Values near zero indicate symmetry.
- Kurtosis: Measures tail heaviness. A kurtosis of 3 suggests normality.
3. Statistical Tests:
- Shapiro-Wilk Test: A formal test for normality. A p-value > 0.05 generally indicates normality.
- Kolmogorov-Smirnov Test: Another normality test, although less sensitive than Shapiro-Wilk.
Applications of the Normal Distribution
- Standardized Testing: Most intelligence and aptitude tests are designed so scores follow a normal distribution.
- Inferential Statistics: Many parametric tests assume normality.
- Confidence Intervals: Assume sampling distributions are normal (especially with large samples due to the Central Limit Theorem).
- Error Analysis: Measurement errors often follow a normal distribution.
For example, in an educational intervention study, student achievement scores are compared pre- and post-intervention. Assuming normality allows for the use of paired t-tests to determine effectiveness. Similarly, in clinical settings, neuropsychological assessments rely on z-scores to evaluate deviations from normative samples.
Conclusion
Probability and the normal distribution are central pillars of statistical reasoning and empirical research in psychology and education. Probability equips researchers with the tools to model uncertainty, quantify risk, and make data-driven decisions. The normal distribution provides a powerful model for interpreting data that naturally cluster around a central tendency.
Understanding these concepts enables more accurate hypothesis testing, better prediction models, and stronger interpretations of test scores and behavior patterns. For practitioners and researchers alike, mastery of probability and the normal distribution is not merely academic—it is a prerequisite for ethical, evidence-based practice and valid scientific inquiry.
References
Howell, D. C. (2009). Statistical Methods for Psychology (7th ed.). Wadsworth Cengage Learning.
Mangal, S. K. (2010). Statistics in Psychology and Education (2nd ed.). PHI Learning Pvt. Ltd.
Niwlikar, B. A. (2025, June 25). Probability and 5 Important Properties of the Normal Distribution Curve. Careershodh. https://www.careershodh.com/probability-and-normal-distribution-curve/