
Introduction
Statistics is a powerful tool for analyzing, interpreting, and making inferences about data. Two fundamental branches of statistical analysis are parametric and non-parametric statistics. Understanding the differences, assumptions, and appropriate applications of these methods is essential for researchers, analysts, and students alike.
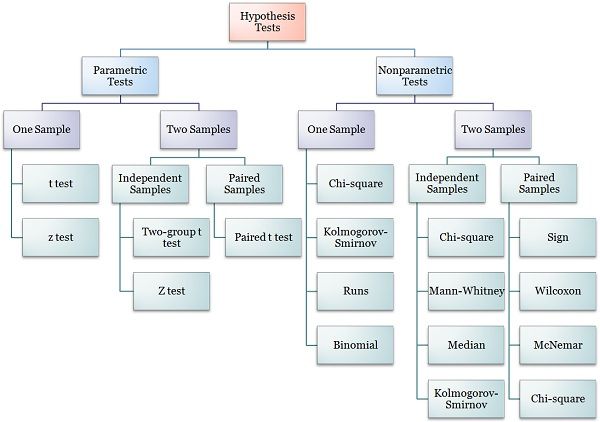
Parametric and Nonparametric Test
Parametric statistics rely on distributional assumptions (usually normality) and estimate population parameters. Non-parametric statistics, by contrast, do not make such assumptions and often use medians, ranks, or signs rather than means and variances. Each approach has strengths, weaknesses, and specific contexts where it excels.
Read More- Correlation
What Are Parametric Statistics?
Parametric statistics are statistical methods that assume the data being analyzed come from a population that follows a certain probability distribution, most commonly the normal (Gaussian) distribution. “Parametric” refers to the estimation of parameters (numerical characteristics) of the population distribution such as the mean (μ) and variance (σ²) (Howell, 2013).
Nature and Key Features
- Distribution assumptions: Typically require normality or other specific distributions.
- Focus on parameters: Concerned with estimating or testing hypotheses about population parameters (e.g., testing if two population means are equal).
- Data scale: Require interval or ratio-level measurement (continuous data).
- Efficiency: Provide maximum statistical power when assumptions are met.
Common Parametric Tests
- t-tests (one-sample, independent, paired)
- ANOVA (Analysis of Variance)
- Pearson correlation coefficient
- Linear regression analysis
Example: An independent samples t-test comparing mean exam scores between two groups assumes the exam scores in each group are approximately normally distributed with equal variances.
What Are Non-Parametric Statistics?
Non-parametric statistics (or distribution-free statistics) are statistical methods that do not assume any particular distribution shape for the data. They are ideal for analyzing data that are ordinal, nominal, or do not satisfy parametric test assumptions (Conover, 1999).
Nature and Key Features
- Few or no distributional assumptions: Do not require normality, making them more robust to outliers and skewed data.
- Rank-based or sign-based: Often use the order or direction of data points instead of actual values.
- Data scale: Can handle ordinal, nominal, or non-normal interval/ratio data.
- Flexibility: Applicable to smaller samples or data with non-homogeneous variances.
Common Non-Parametric Tests
- Mann-Whitney U test (for two independent samples)
- Kruskal-Wallis H test (for multiple independent groups)
- Wilcoxon signed-rank test (for paired data)
- Spearman’s rank correlation coefficient
- Chi-square tests (for categorical variables)
Example: A Mann-Whitney U test compares ranks of test scores between two groups without assuming normality.
Key Differences Between Parametric and Non-Parametric Statistics

Parametric Vs Non-Parametric Statistics
Assumptions of Parametric vs. Non-Parametric Tests
Parametric Assumptions
- The dependent variable is measured on a continuous scale.
- Data are approximately normally distributed.
- Homogeneity of variances (equal variances between groups).
- Independence of observations.
Non-Parametric Assumptions
- No requirement of normality.
- Applicable to ordinal or nominal scales.
- Fewer assumptions about homogeneity or variance equality.
- Still requires independent observations (for most non-parametric tests).
When to Choose Parametric vs. Non-Parametric Methods
Choose parametric methods if:
- Data are approximately normally distributed.
- The dependent variable is measured on an interval or ratio scale.
- Assumptions of homogeneity and independence are met.
- You want to estimate population parameters precisely.
Choose non-parametric methods if:
- Data are ordinal, nominal, or not normally distributed.
- The sample size is small.
- Assumptions of parametric tests are violated (e.g., heterogeneity of variance).
- Outliers are present that could unduly influence parametric results.

Parametric and Non-Parametric Alteratives
Historical Perspective
The foundations of parametric statistics trace back to the late 19th and early 20th centuries, when the central limit theorem and properties of the normal distribution were formalized by statisticians like Karl Pearson and Ronald Fisher (Pearson, 1895; Fisher, 1925). The Student’s t-test, developed by William Sealy Gosset under the pseudonym “Student” (1908), is a classic parametric method.
Non-parametric methods gained prominence with the work of statisticians such as Frank Wilcoxon (1945), Maurice Kendall, and Henry Mann & Donald Whitney (1947), who developed tests suitable for non-normal data or ordinal scales.
Limitations of Both Approaches
Limitations of Parametric Tests:
- Invalid results if assumptions are violated.
- Over-reliance on normality in small samples can mislead conclusions.
Limitations of Non-Parametric Tests:
- Do not estimate effect sizes or parameters like means and variances.
- Lower power means a larger sample may be needed to detect an effect.
Recent Developments and Alternatives
Modern robust statistical methods, such as bootstrapping, provide ways to estimate parameters without strict distributional assumptions. Bayesian statistics also offers flexible alternatives to classical parametric and non-parametric inference.
Conclusion
Both parametric and non-parametric statistics are essential tools in a researcher’s toolkit. Rather than seeing them in opposition, it is more practical to recognize them as complementary methods that serve different purposes depending on the nature of the data. Choosing the right test ensures the validity of statistical conclusions, minimizes errors, and improves research quality.
References
Conover, W. J. (1999). Practical nonparametric statistics (3rd ed.). Wiley.
Fisher, R. A. (1925). Statistical methods for research workers. Oliver & Boyd.
Gosset, W. S. (1908). The probable error of a mean. Biometrika, 6(1), 1–25.
Howell, D. C. (2013). Statistical methods for psychology (8th ed.). Cengage Learning.
Mann, H. B., & Whitney, D. R. (1947). On a test of whether one of two random variables is stochastically larger than the other. Annals of Mathematical Statistics, 18(1), 50–60.
Pearson, K. (1895). Contributions to the mathematical theory of evolution. Philosophical Transactions of the Royal Society A, 186, 343–414.
Wilcoxon, F. (1945). Individual comparisons by ranking methods. Biometrics Bulletin, 1(6), 80–83.
Niwlikar, B. A. (2025, July 10). Parametric and Non-Parametric Statistics: 6 Important Differences Between Them. Careershodh. https://www.careershodh.com/parametric-and-non-parametric-statistics/