
Introduction
In the fields of psychology and education, data collection and interpretation play a crucial role in informing decision-making, evaluating outcomes, and conducting research. Descriptive statistics are foundational tools that enable researchers and educators to organize, summarize, and draw initial insights from data. They serve as the first step in the data analysis process before proceeding to inferential statistics, which deal with hypothesis testing and predictions.
Among the various elements of descriptive statistics, measures of central tendency hold a place of paramount importance. They help in identifying the “center” of a dataset and offer a summary statistic that represents an entire distribution. Alongside central tendency, measures of variability provide insight into the spread of data, while graphical methods and an understanding of distribution shapes help in visualizing and interpreting data more effectively.
Read More- Reliability
Measures of Central Tendency
Measures of central tendency refer to statistical values that represent the central point or typical value within a dataset. They are used to summarize a set of values with a single representative number. The most commonly used measures include the mean, median, and mode, each offering unique insights and being suited to different types of data or research contexts.
1. Mean (Arithmetic Average)
The mean is the sum of all the values in a dataset divided by the number of observations. Mathematically, it is represented as:
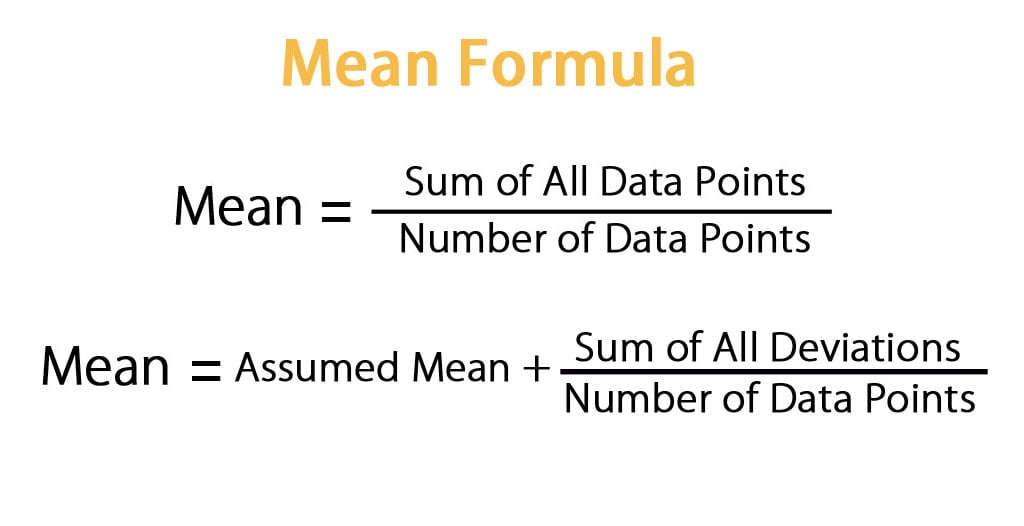
Mean Formula
Advantages of the Mean:
- Utilizes all data points in the dataset.
- Easily manipulated algebraically, making it suitable for further statistical operations like variance and standard deviation.
- Highly useful in parametric testing.
Disadvantages of the Mean:
- Highly sensitive to extreme values or outliers. For example, in a dataset like {10, 12, 13, 14, 100}, the mean is significantly skewed by the value 100, despite most values clustering around 10–14.
- Not always appropriate for skewed distributions.
In psychological and educational research, the mean is frequently used to calculate average test scores, response times, or behavioral metrics. However, researchers must always check for outliers and skewness before drawing conclusions based solely on the mean.
2. Median
The median is the middle value in a dataset when arranged in ascending or descending order. If the number of values is odd, the median is the middle number; if even, it is the average of the two middle numbers.

Median
Advantages of the Median:
- Not affected by outliers or skewed data.
- More representative of central tendency when data are not symmetrically distributed.
Disadvantages of the Median:
- Does not utilize every data point (unlike the mean).
- Less mathematically tractable for further statistical analysis.
The median is particularly useful in educational assessments where a few students may score extremely low or high compared to the rest. In such cases, the median gives a better idea of the “typical” performance than the mean.
3. Mode
The mode is the value that appears most frequently in a dataset. A dataset may be:

Relation between Mean, Median and Mode
- Unimodal: One mode
- Bimodal: Two modes
- Multimodal: More than two modes
- No mode: No value repeats
Advantages of the Mode:
- The only measure that can be used for nominal data (e.g., eye color, preferred teaching method).
- Simple and intuitive.
Disadvantages of the Mode:
- May not be unique or may not exist.
- Doesn’t give a clear picture in datasets with high variability or equal frequencies.
In psychology, mode can be useful in understanding the most commonly exhibited behavior or response. In educational research, it helps identify the most chosen multiple-choice answer, which can indicate misconceptions or effective distractors in test design.
Comparing Mean, Median, and Mode
Each measure of central tendency offers a unique perspective and is best suited for different types of data or research questions. Their use is influenced by the level of measurement (nominal, ordinal, interval, or ratio) and the shape of the data distribution.
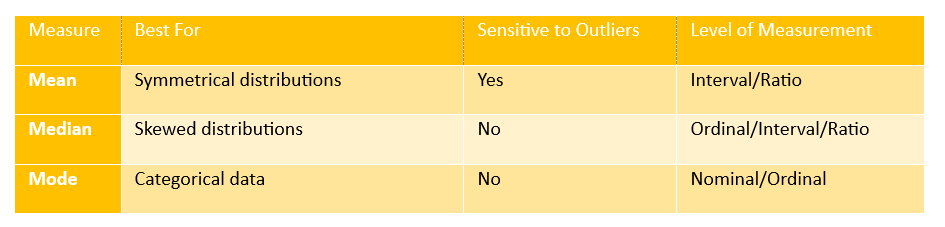
Measure of Central Tendency
Understanding when to use which measure is essential for accurate and meaningful interpretation. For example, reporting the average income in a community using the mean can be misleading if there are a few ultra-rich individuals skewing the data upward. In such a case, the median provides a more accurate reflection of the typical income.
Measures of Variability
While measures of central tendency tell us where data are centered, measures of variability indicate how spread out the data points are around that center. They help in understanding the consistency, diversity, and reliability of data.
1. Range
The simplest measure of dispersion, calculated as:

Range
While easy to compute, the range is extremely sensitive to outliers and does not provide information about the distribution of values between the extremes.
2. Variance and Standard Deviation
Variance measures the average squared deviation from the mean. It is denoted as:

Variance
Standard deviation is the square root of the variance:

Variance and Standard Deviation of a Sample
These are foundational in inferential statistics, used in hypothesis testing and confidence intervals. Standard deviation, especially, is widely interpreted as it retains the original units of the data, unlike variance.
3. Interquartile Range (IQR)
The IQR measures the spread of the middle 50% of data and is calculated as:

Interquartile Range
IQR is robust to outliers and is commonly used in boxplots.
Graphical Representations of Data
Graphs and charts make data accessible and interpretable. They allow researchers to identify patterns, trends, and anomalies quickly.
1. Histograms
Histograms show the frequency distribution of interval or ratio data using contiguous bars. The shape of a histogram can reveal whether a distribution is normal, skewed, or bimodal.
2. Boxplots
Boxplots visually depict the median, quartiles, and potential outliers. They are particularly useful in comparing distributions across multiple groups.
3. Stem-and-Leaf Plots
These combine numeric and visual information. Each number is split into a “stem” (leading digit) and a “leaf” (trailing digit), giving a quick sense of distribution and allowing individual values to be seen.
Understanding Distribution Shapes
The shape of a distribution affects both the selection and interpretation of central tendency measures.
Symmetric Distributions
In a normal (bell-shaped) distribution, the mean, median, and mode coincide. This symmetry is essential in many parametric statistical methods.
Skewed Distributions
- Positively skewed: Tail extends to the right; mean > median.
- Negatively skewed: Tail extends to the left; mean < median.
In such cases, the median often serves as a better central measure.
Kurtosis
This measures the “peakedness” of a distribution:
- Leptokurtic: High peak
- Platykurtic: Flat peak
- Mesokurtic: Normal kurtosis
Understanding skewness and kurtosis is crucial in choosing appropriate statistical methods and ensuring valid interpretations.
Applications in Psychology and Education
In psychology, measures of central tendency are used to summarize test scores, reaction times, and survey responses. For instance, the average depression score on the Beck Depression Inventory can indicate the overall mental health trend in a sample.
In education, average marks, attendance rates, and student satisfaction levels are often reported using central tendency measures. Policymakers, school administrators, and curriculum designers rely on these statistics to make data-informed decisions.
Central tendency measures also serve as the basis for comparing groups—for example, determining whether boys and girls perform differently on a standardized test or whether a new teaching method has increased average student achievement.
Conclusion
Measures of central tendency—mean, median, and mode—are indispensable tools in the statistical toolkit of psychologists and educators. They allow complex datasets to be summarized succinctly and interpreted meaningfully. Each measure offers distinct advantages and limitations, and their appropriate use depends on data type, distribution, and research objectives.
Complementing these are measures of variability and graphical tools, which provide further insight into the data’s spread and structure. Together, these components of descriptive statistics form the bedrock of quantitative analysis, facilitating a deeper understanding of human behavior, learning outcomes, and psychological processes.
A strong command of these concepts empowers researchers and educators to critically evaluate data, design better interventions, and contribute to evidence-based practice.
References
Howell, D. C. (2009). Statistical Methods for Psychology (7th ed.). Wadsworth Cengage Learning.
Mangal, S. K. (2010). Statistics in Psychology and Education (2nd ed.). PHI Learning Pvt. Ltd.
Niwlikar, B. A. (2025, June 23). 3 Important Measures of Central Tendency. Careershodh. https://www.careershodh.com/measures-of-central-tendency/