
Introduction
Correlation is a foundational statistical concept used to examine the degree and direction of association between variables. It allows psychologists, educators, and social scientists to answer critical questions about behavioral patterns, cognitive traits, and academic outcomes. For example, is there a relationship between stress and academic performance? Does a student’s motivation predict their grades?
While correlation doesn’t establish causality, it is indispensable in generating hypotheses, developing measurement tools, and making informed predictions.
Correlation
Correlation refers to a statistical measure that describes the strength and direction of a linear relationship between two variables. It is denoted by the symbol “r”, known as the correlation coefficient, which ranges from –1 to +1:
- +1: Perfect positive relationship.
- –1: Perfect negative relationship.
- 0: No relationship.
The closer the coefficient is to the extremes (±1), the stronger the linear relationship. Positive values indicate that both variables move in the same direction, while negative values mean they move in opposite directions.
Read More- Experimental Design
Nature of Correlation
Understanding the nature of correlation involves looking at three key aspects:
a. Direction
Positive, Neutral, and Negative Relationship
- Positive Correlation: Both variables increase or decrease together.
- Negative Correlation: One variable increases as the other decreases.
b. Strength
Measured by how close the coefficient is to ±1:
- Strong (r > ±0.70)
- Moderate (±0.40–0.69)
- Weak (±0.10–0.39)
- None (r = 0)
c. Form
- Linear Correlation: A consistent change in one variable corresponds to a consistent change in the other.
- Nonlinear Correlation: The relationship exists but follows a curved pattern, not a straight line.
Types of Correlation
Correlation is classified in various ways depending on the number of variables, their type, and the pattern of relationship.
a. Based on Number of Variables
- Simple Correlation: Between two variables (e.g., IQ and GPA).
- Partial Correlation: Relationship between two variables while controlling for a third (e.g., IQ and GPA while controlling for motivation).
- Multiple Correlation: Involves more than two variables influencing a single outcome.
b. Based on Nature of Variables
- Positive vs. Negative
- Linear vs. Nonlinear
- Biserial, Point-Biserial, Phi Coefficient: Used for categorical or dichotomous variables in psychological testing.
Importance and Applications in Psychology
Correlation plays a critical role in research and practice:
- Prediction- If verbal ability correlates strongly with reading comprehension, educators can use one to predict the other.
- Test Validation- Correlation is key in construct, criterion-related, and concurrent validity assessments. A new anxiety inventory might be correlated with an established one to test concurrent validity.
- Hypothesis Formation- Correlation studies often precede experimental research, offering preliminary insights into variable relationships.
- Behavioral Insight- Correlating personality traits with academic or social behavior helps build behavioral theories in psychology and education.
Methods of Studying Correlation
Two main categories:
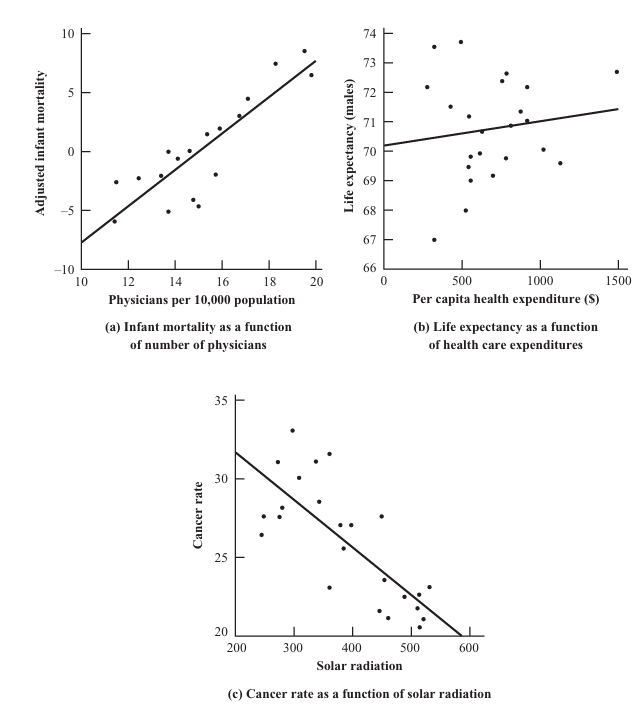
a. Graphical Method and Scatter Diagram
- Plots data pairs (X, Y) on a graph.
- The pattern of dots reveals the direction and strength of the relationship.
- Useful for identifying outliers and nonlinear trends.
b. Mathematical Methods
Used to quantify relationships:
- Pearson’s Product-Moment Correlation Coefficient
- Spearman’s Rank-Order Correlation Coefficient
- Kendall’s Tau
- Point-Biserial and Phi Coefficients (for categorical data)
Pearson’s Product-Moment Correlation Coefficient
Used for continuous and interval/ratio scale data where the relationship is expected to be linear.
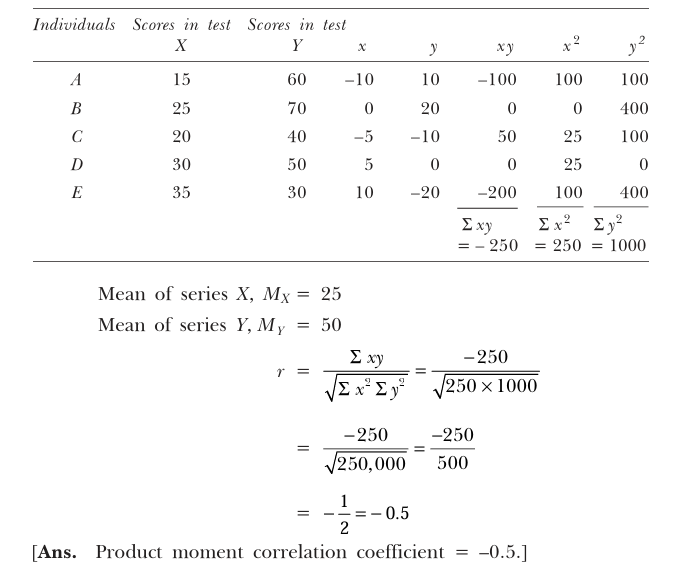
Pearson’s Correlation Coefficient
Assumptions of Pearson’s Correlation
To use Pearson’s r appropriately, the following assumptions must be met:
- Linearity: The relationship between variables is linear.
- Scale of Measurement: Variables should be measured at the interval or ratio scale.
- Normality: Both variables should be approximately normally distributed.
- Homoscedasticity: The variance of one variable should be similar across the levels of the other.
- Independence of Observations: Each data point is independent of others.
Violation of assumptions (especially linearity and normality) can result in misleading correlation coefficients and incorrect conclusions.
Spearman’s Rank Correlation Coefficient
Used when data are ordinal, non-normally distributed, or when the relationship is nonlinear but monotonic.

Spearman Correlation
Assumptions of Spearman’s Correlation
Spearman’s rho is less restrictive but still has assumptions:
- Ordinal or Interval Data: Variables must be rankable.
- Monotonic Relationship: The relationship must consistently increase or decrease.
- Independence: Observations should be independent.
- Paired Observations: Each subject must have data for both variables.
This method is ideal for questionnaire responses, ranked preferences, or when sample size is small and normality cannot be assumed.
Misinterpretations and Cautions
Despite its widespread use, correlation is subject to misuse:
- Correlation ≠ Causation- A high correlation does not imply one variable causes the other. For example, ice cream sales and drowning rates may correlate but both are influenced by summer weather.
- Outliers- Extreme values can drastically skew results, especially in Pearson’s r.
- Range Restriction- A limited range in either variable can weaken the apparent correlation, hiding a real relationship.
- Spurious Correlations- A third variable may influence both correlated variables, creating a false impression of a direct relationship.
Graphical Representation and Interpretation
Visualizations aid interpretation:
- Positive Linear: Upward slope of points.
- Negative Linear: Downward slope.
- No Correlation: Scattered points with no pattern.
- Nonlinear Relationship: Curved patterns, e.g., an inverted-U shape.
Scatterplots are essential for checking linearity, outliers, and data integrity before applying correlation coefficients.
Limitations of Correlation
Some limitations of correlation include-
- Cannot Identify Causality
- Assumes Linear Relationship (unless using nonparametric methods)
- Sensitive to Sampling Error
- Affected by Measurement Error
- Confounding Variables are not controlled (unless using partial correlation)
Conclusion
Correlation is a vital analytical tool in psychological and educational research. It enables researchers to explore relationships, form hypotheses, validate measurement tools, and make informed decisions. However, for correlation to yield meaningful results, its assumptions must be carefully met, and interpretations must be cautious, especially regarding causality.
By understanding the principles, methods, assumptions, and pitfalls of correlation, researchers can more effectively use this technique to uncover patterns in human behavior and educational outcomes—paving the way for more robust and insightful studies.
References
Guilford, J. P., & Fruchter, B. (1978). Fundamental Statistics in Psychology and Education. McGraw-Hill.
Howell, D. C. (2009). Statistical Methods for Psychology (7th ed.). Wadsworth Cengage Learning.
Minium, E. W. (1970). Statistical Reasoning in Psychology and Education. Wiley.
Gravetter, F. J., & Wallnau, L. B. (2007). Statistics for the Behavioral Sciences (7th ed.). Thomson Wadsworth.
Niwlikar, B. A. (2025, June 30). Correlation: Concept, Meaning, and 3 Important Ideas in Its Nature. Careershodh. https://www.careershodh.com/correlation/